![]()
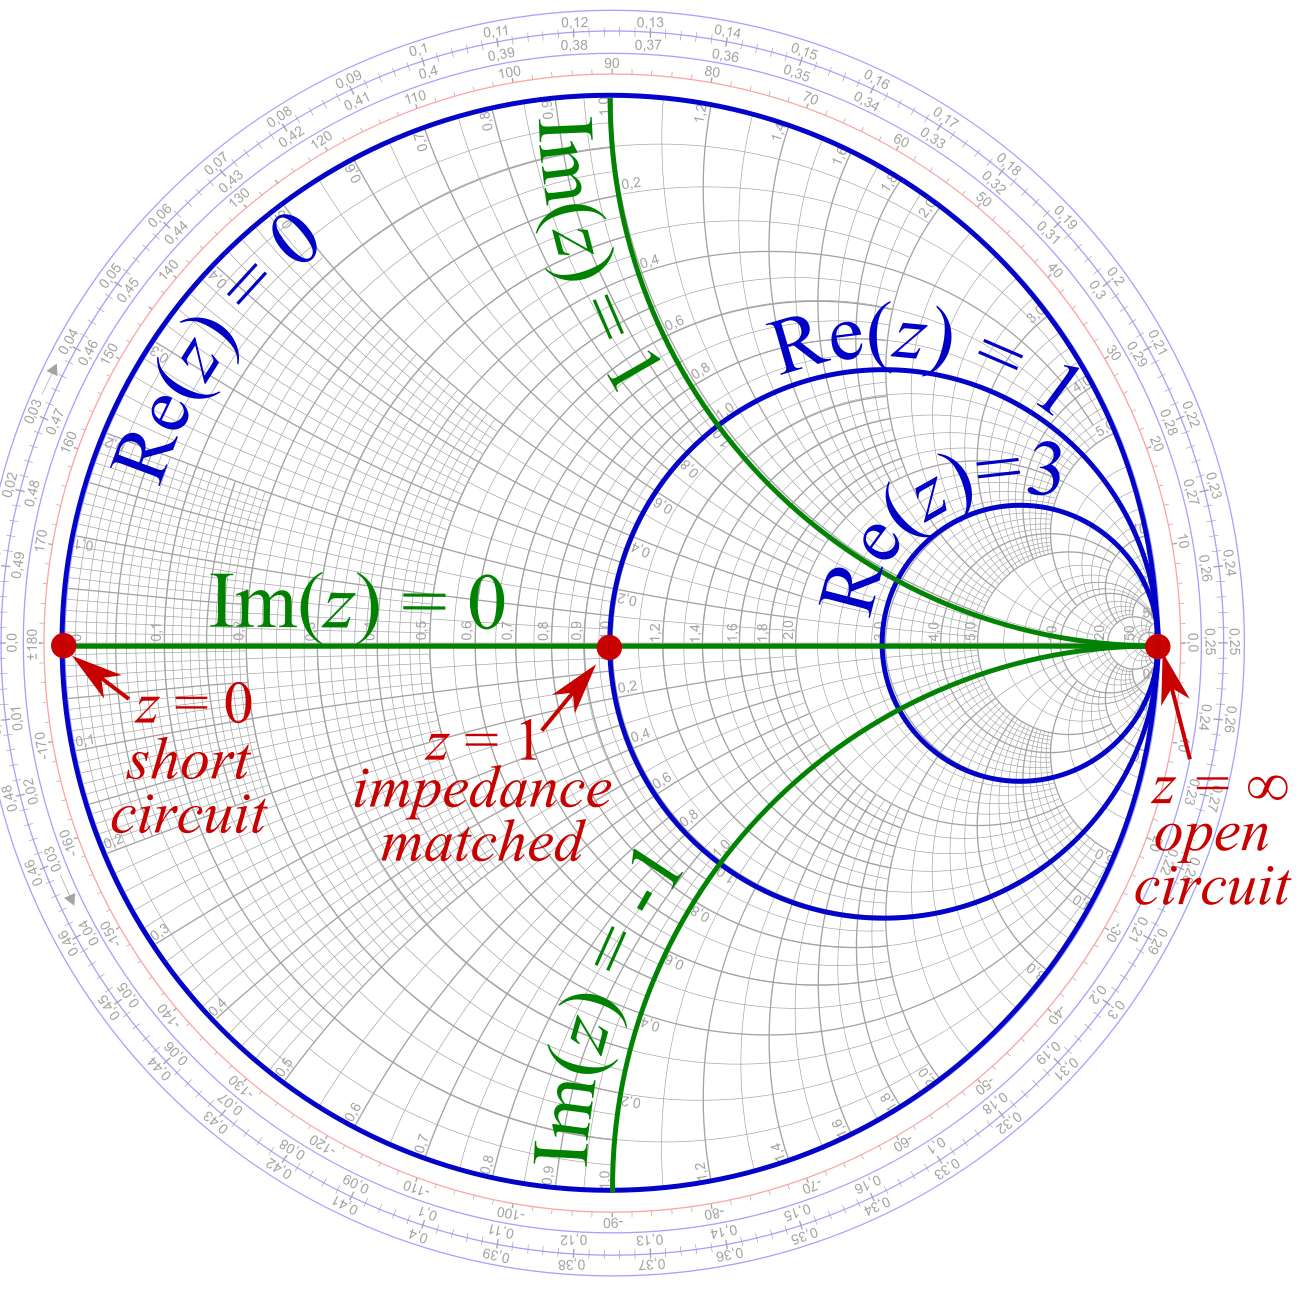
In any text book on transmission lines which show a Smith Chart, an open circuit is shown on the right (phase angle = 0°) and short circuit on the left (phase angle = 180°), as shown on the following Smith Chart
After performing a calibration of a VNA, many people put the open and short calibration standards on the VNA, measure their S-parameters and think they have a problem as after measuring the opens and shorts are shown as arcs, not dots as they expected! The photograph below shows the HP 8720D VNA screen after the calibration standards of an expensive HP 85052B (26.5 GHz 3.5 mm) were measured. The sweep range has been limited to 7 GHz, with markers at the lowest frequency (50 MHz), as well as 500 MHz, 2 GHz, 4 GHz and 7 GHz.
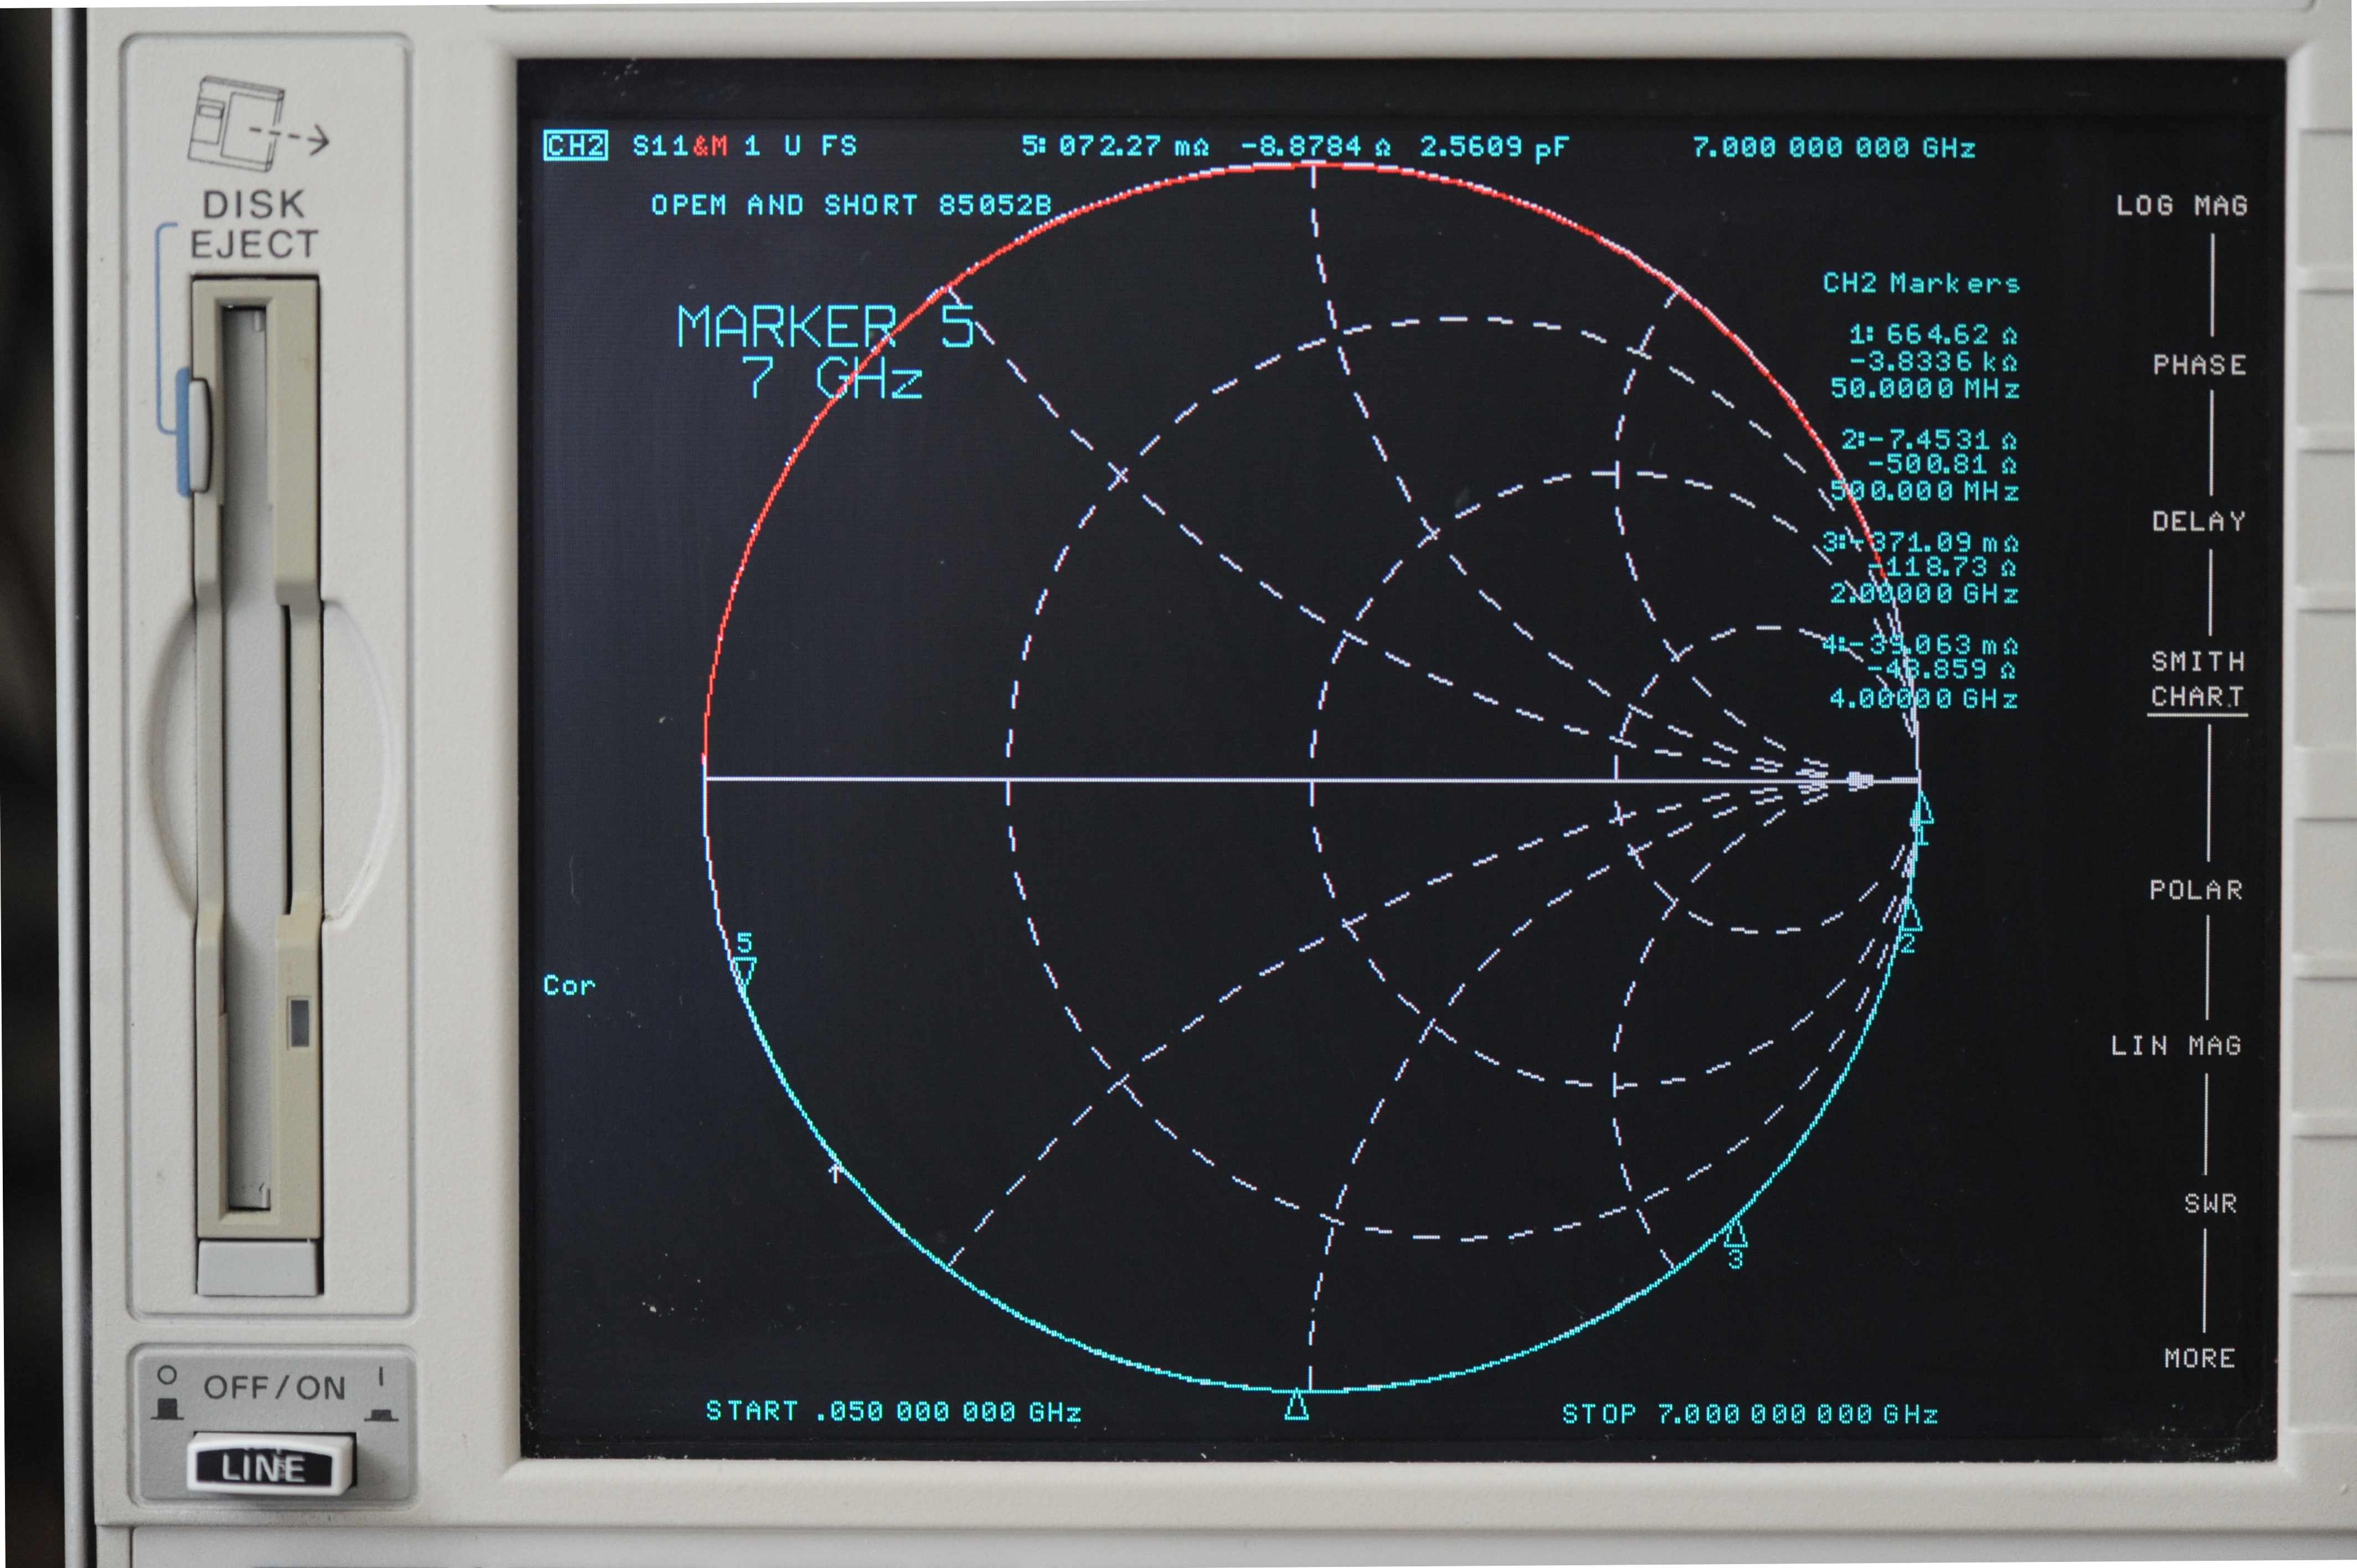
The cyan trace shows the result of measuring the open circuit which is stored in memory. The red trace shows the short circuit. As you can see, they are arcs, even on this very expensive Keysight 85052B 26.5 GHz 3.5 mm calibration kit. Although this is not shown, if the frequency is increased to approximately 7.9 GHz, the short appears as an open, and the open appears as a short! In fact, on a 26.5 GHz 3.5 mm kit, the arcs would have gone around the Smith Chart more than once! Many people do not expect this, so are confused, and believe there's a problem. We will explain why this happens, and why it is to normal.
Although the calibration standards of a SOLT (short, open, load, thru) calibration kits are usually called opens and shorts, a more accurate name for almost all calibration standards would be offset open and offset short. Each calibration standard has a length of transmission line, after which the inner conductor is either left unconnected (an open standard) or shorted to the outer conductor (a short standard). This length of transmission line adds a delay, so the phases are no longer 0° and 180°. However, there are two other effects too.
Just to make life complicated, neither the fringing capacitance of the open, nor the inductance of the short are independent of frequency. However, for many applications the inductance of the short may be ignored. But the capacitance of the open should never be ignored, and for frequencies above a few hundred MHz, it is necessary to take into account the variation of capacitance with frequency.
Some people who attempt to make their own calibration kits go to great lengths to make the offset length of the short as little as possible. Various people write about the important of this. These people do not understand how VNAs perform the calibration, so don't understand the error of their ways. The following shows the phase of the open and short. It is the same data as in the photo above, but just represented as a phase rather than a Smith Chart
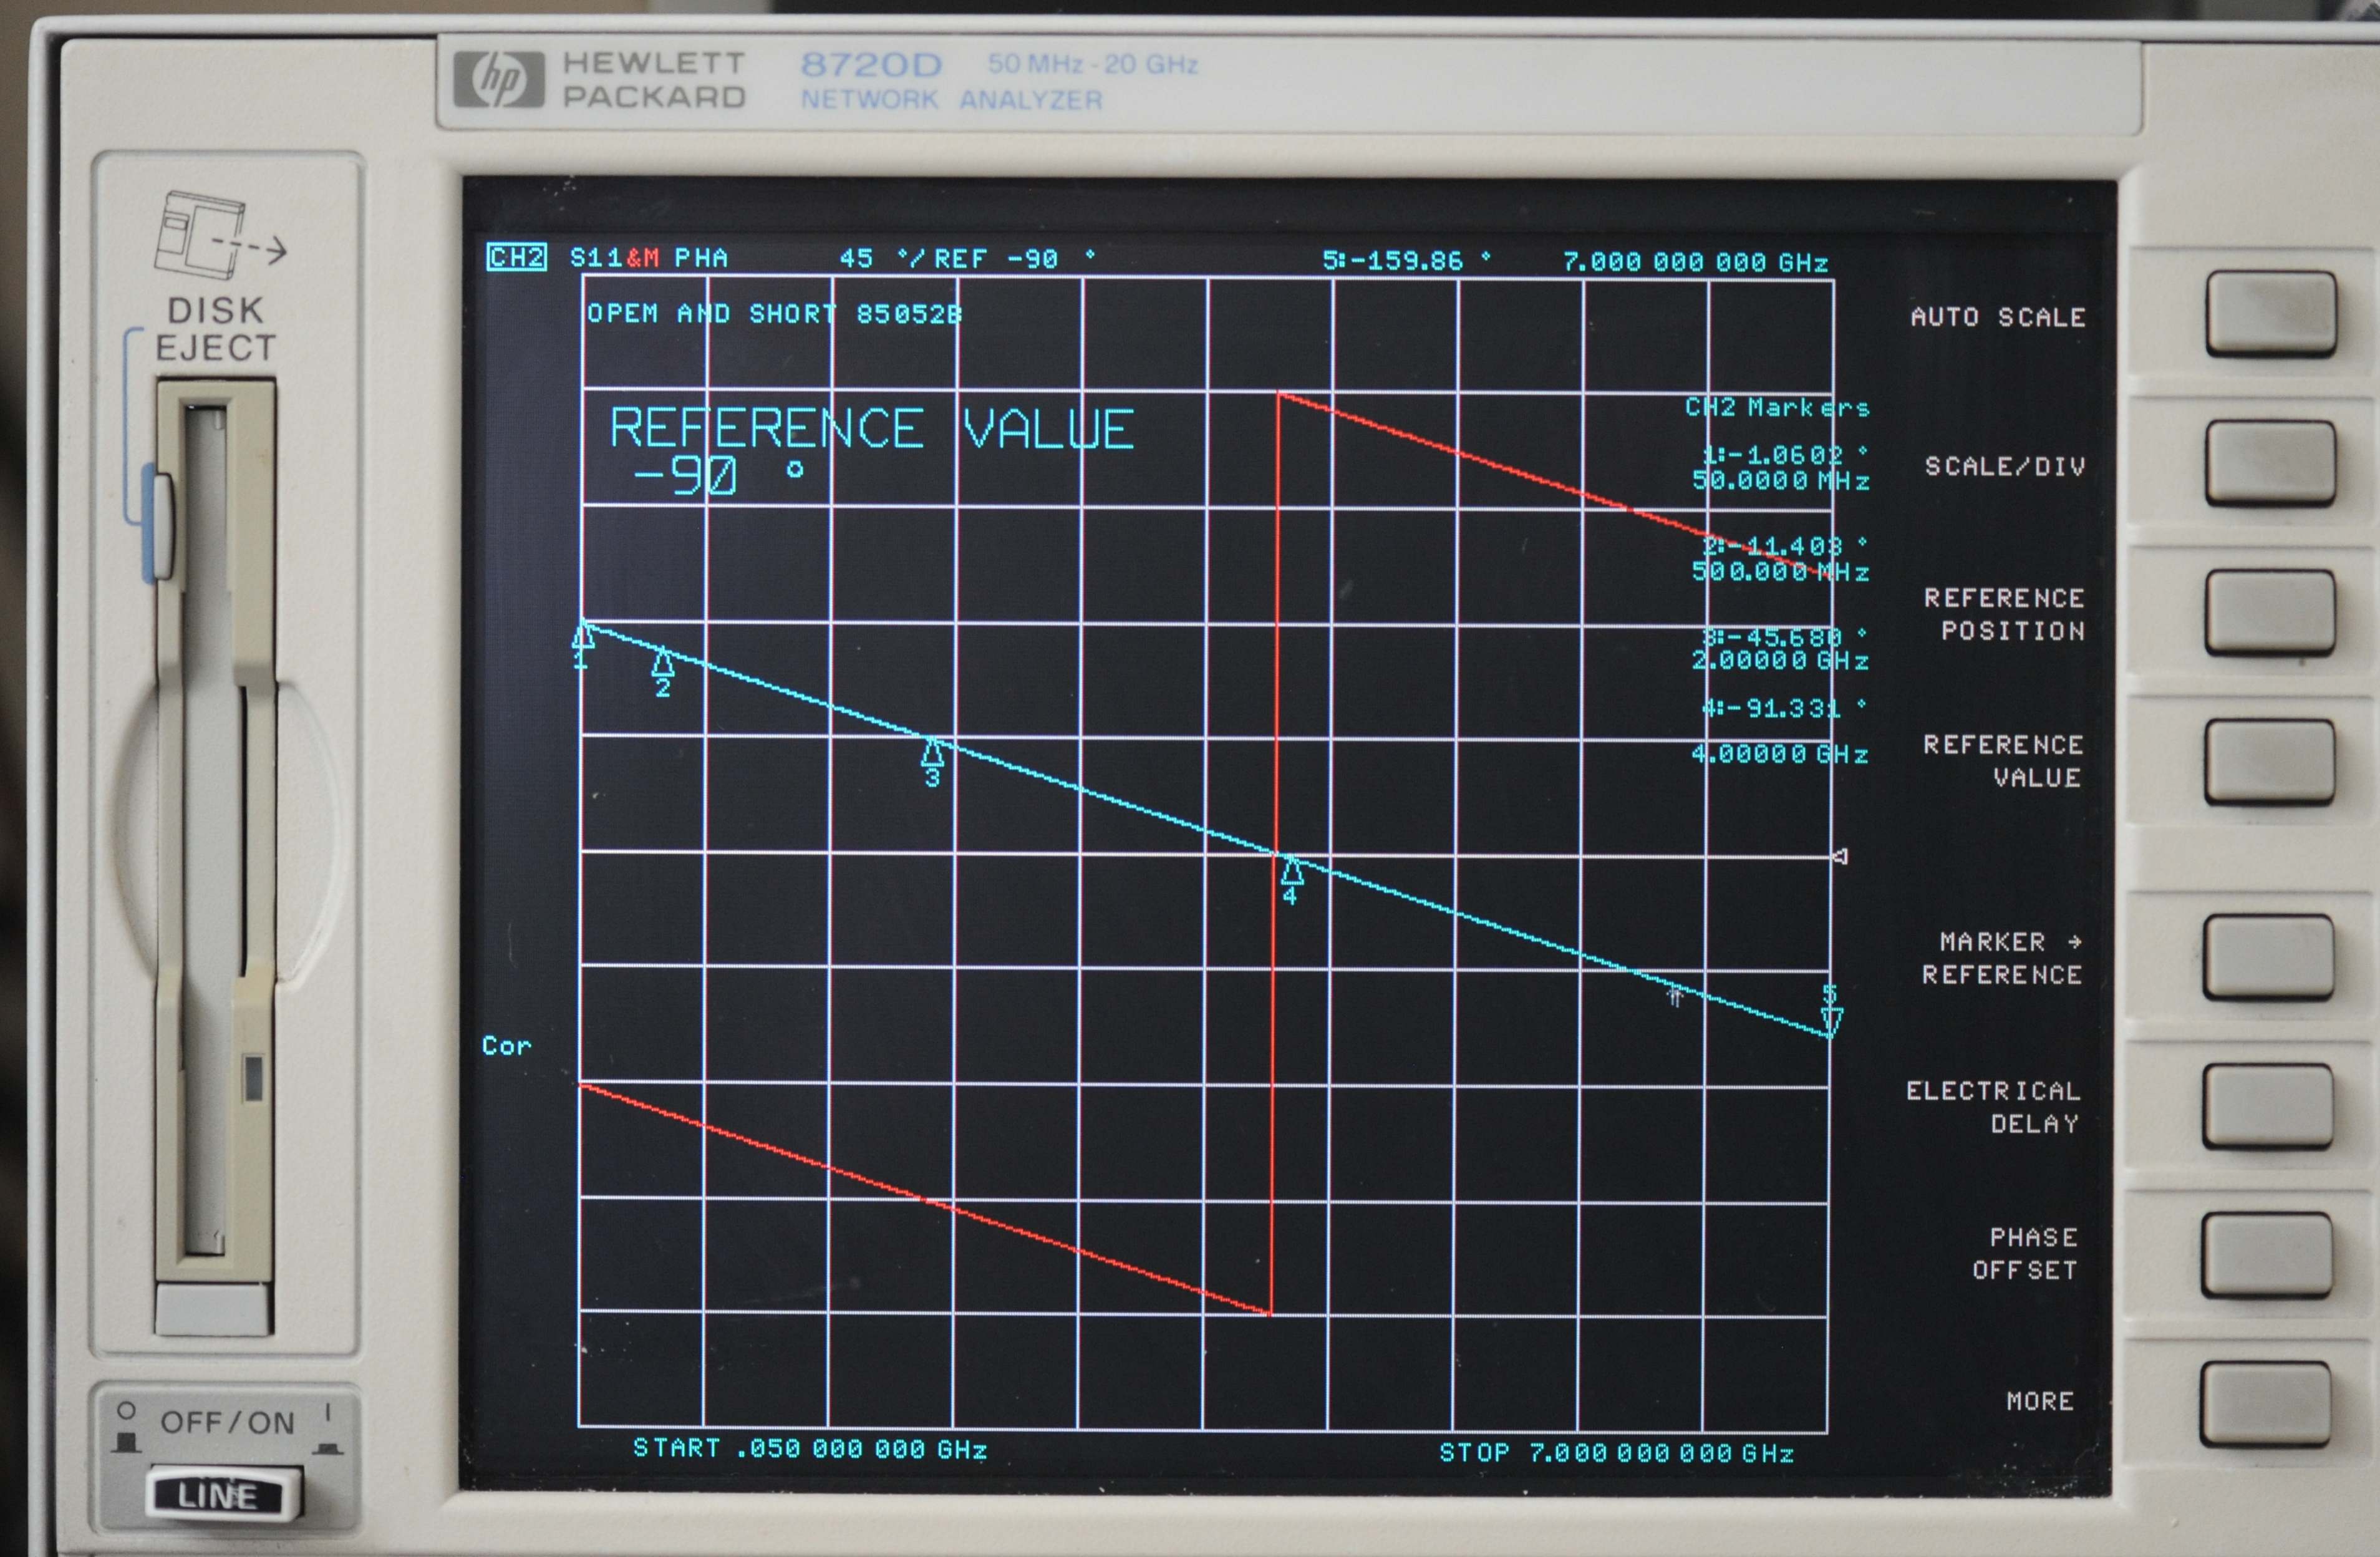
Note the distance between the open (cyan) and short (red) lines is always very close to 4 vertical divisions. Since each division is 45°, the difference between the phase of the open and short are always close to 180°, which is the optimal value for VNA calibration. It leads to the most accurate results, and is less susceptible to noise than if two standards have a phase difference which is not close to 180°.
Kirkby Microwave Ltd is registered in England and Wales, company number 08914892. Registered office: Stokes Hall Lodge, Burnham Rd, Althorne, Essex, CM3 6DT.